Over the past five years or so I have taken a deeper interest in philosophy. More to the point, I have become especially curious as to WHY certain philosophies are adopted over others.
If you have had the chance to listen to my podcast “Cradle of Analytics”, you may know that I spent ten episodes (and nearly nine hours) explaining the “Origins of Analytics”, and why I believe that so-called “deductive-analytical thinking” is at the root of Western culture and philosophy. While the capability to thinking deductive-analytically comes from writing, the appetite for this mode of thinking can be traced back to Mesopotamian financial interest based contracts from as far back as 5,900 BCE, starting with the Ubaidian culture, followed by Sumerian culture who developed temples into early banking institutions. The Phoenicians would ultimately transmit this knowledge of usury to the Greeks in the 9th century BCE.
In my view, Western culture and philosophy has more-or-less been adopted as a “meta-philosophy” that subconsciously affects the core of our very thinking. It is part of our identity now. I argue in the podcast that this appetite for “deductive analytical” thinking (or “digital thinking” as opposed to “analog thinking”) emanated from Mesopotamia and was eventually codified by Aristotle in the 4th century BCE, and that this codification of deductive logic (the “syllogism” as described in Aristotle’s “Prior Analytics”) quickly led to the development of the “axiomatic method” (as codified by Euclid), and would eventually lead to the scientific revolution as best exemplified by Johannes Kepler (superseding Galileo Galilei) and best codified by Charles Sanders Pierce (superseding William Whewell). This in turn has led us to humankind’s ultimate product of thinking efficiency: The invention of the Turing complete programmable computer. This invention will eventually automate all rules-based tasks – if we allow them to, and possibly allow humanity to expand across the universe in a scalable manner – if we have the will.
In other words, I believe that there is a vein of history that you can trace from today back nearly 8,000 years and see that there has been for some time evidence of “digital thinking”. In fact, all Western religions (Judaism, Christianity, Islam) run off this same basic operating system of so-called “sovereign laws” which are structured as ‘If A then B’. Digital code runs deep in our collective imagination even if we don’t realize this consciously.
Digital thinking is often wrong – but it is always efficient.
I should point out that non-Western “analog” thinking tends to be based on – you guessed it – thinking through analogies. Charles Sanders Pierce coined the term “abduction” which describes a specific application of analogy thinking to solve problems. Abduction is very difficult to explain and is often conflated with deduction, and philosophers and psychologists argue over what it is to this very day.
The point is, digital thinking tends to be more top-down and is efficient because it leverages what we might call “artificial intelligence” (which is to say formulas and rules that have already been tried and tested), but can sometimes lead you astray, often with disastrous consequences. Whereas “analog” thinking leans more on abduction and is where genius resides, but is less powerful without the aid of formulas and rules to build upon.
I could go on here, but I don’t want to digress too much.
If you are specifically curious about the origins of Western philosophy, just listen to the podcast.
The reason why I bring this up and the main point I am making here and in my podcast is that I have come to see top-down thinking and bottom-up thinking as philosophies unto themselves and we often don’t realize when we are embracing one philosophy and not the other. In this blog post I will be explaining and demonstrating that Microsoft Power BI has adopted a more “top down” philosophy whereas Qlik offers a more “bottom up” philosophy, and why I believe the “bottom up” philosophy is often ignored even though I believe it offers advantages and benefits over Microsoft’s “top down” philosophy.
Put another way, I might just label these two philosophies (which can both to a large extent be followed within Power BI):
- The Tao of Microsoft Power BI data modelling
- The Tao of Qlik data modelling
But before I show you the example which illustrates the differences I should go over some history…
To understand the relationship between Power BI and Qlik, you need to back to the origins of Qlik and Power BI. Here is my abridged version of Qlik and Power BI’s history (I apologize if I have made any errors here):
In 1993 the first version of QlikView (originally called “QuikView” after the acronym: Quality; Understanding; Interaction; and Knowledge) was released. QlikTech (the owning company) was [and to a large extent still is] based in Sweden. The first two versions of QlikView were built on Microsoft Excel.
What differentiated QlikView from other BI tools was and is its colour coded filter boxes (known as “List Boxes” in QlikView and “Filters” in Qlik Sense). I refer to this capability as Qlik’s “State-Aware User-Experience” or “State-Aware UX”.
In 1997 version 3 of QlikView is released. But it has now been entirely rewritten in compiled “C” language for maximum efficiency.
This version of Qlik also codified two other aspects of Qlik that would become both indispensable and difficult to explain:
- A SEMI-JOIN link indexing system for efficient semi-joins
- The main benefit of this is that this allows us to easily integrate multiple fact tables without running into a “fan trap” that leads to duplicates which normally occur when JOINing multiple Fact tables to form “cubes”
- The other benefit of this is that this enables self-serve Data Prep, since it is possible to naïvely (or playfully) integrate new entities in a modular way that is safe and does not corrupt existing entities through merge/join set operations which can lead to “fan trap” duplicates
- An associative storage and query engine. This associative engine stores every unique data element value exactly once with all tables and columns pointing back to a reference of this value – regardless of whether the value is a number, a date or a string.
- The benefit of this associative index is to both:
- Improve data compression; and
- Facilitate full text and numeric range searching, so that even if you don’t know where a specific value might be located in the data model (e.g. your last name), you can easily search against all rows and columns instantly from a single search bar through this “associative index”. It’s really quite a useful feature
- It should be noted that Qlik refers to ALL of its innovations under the banner “Associative” even though this is the only feature that is strictly associative (based on the academic definition of “associative”)
To summarize, here are Qlik’s salient features that distinguished it from its competitors at this time (and to a large extent even to the present day):
- State-Aware User Experience
- Linking SEMI-JOIN Model
- Associative full text searching
Even with these benefits Qlik did not at this time displace incumbent BI (Business Intelligence) platforms like Cognos, Business Objects, Microstrategy, and Microsoft Analysis Services, in the same way the automobile displaced the horse.
One possible explanation for this is that most BI platforms are never used for business analytics to begin with and are merely glorified data extraction engines, whereby users will simply:
- Find a report (or reports) they need
- Download all reports into an Excel friendly format (e.g. CSV, TAB, XLS, XLSX)
- Open the CSV or Excel documents in a new Excel workbook and begin a process of manual Data Prep usually entailing: Cut-copy-paste; VLOOKUP (to integrate data); and Pivot Tables (to summarize data)
- Present the final output in the form of a beautified Excel document or PowerPoint/PDF Report
That notwithstanding, there is a need for interactive dashboards that go above and beyond glorified data extraction engines, so you would think that Qlik would be more successful during this time with so little competition.
Unfortunately, this is not how technology and innovation works.
Henry Ford is said to have once said “If I asked people what they wanted, they would ask for a faster horse.” With Ford here implying that people would not ask for an automobile because they could not conceive of it even though they would clearly benefit from its efficiencies. History has been kind to this quote (Ford himself was not a very nice man).
With something like an automobile it is easy to see its benefits and why one would want an automobile over a horse. But most innovations are not as apparent as most inventions are often just a cog in a bigger machine. Unless you can overturn the entire machine itself (and not just improve parts of it), then you are always in a vulnerable position as an innovator.
This unfortunately is where Qlik has always been; A set of clever – even brilliant - inventions but not enough to overturn how the entire eco-system that Business Intelligence software thrives in. This eco-system includes databases, ETL tools, Semantic Layers, and Data Visualization tools, not to mention the IT professionals who have staked their careers in learning these tools and how they interact with one another.
I will continue to explain Qlik’s history, but first I should point out when I first came to learn about Qlik and how I saw its history unfold before my own eyes.
It was in 2005 while on a vacation in Florida. I reconnected with a friend of my wife who had recently become very interested in Business Intelligence. She had heard that I had also worked in BI and wanted to get my opinion about some software she and a colleague had developed some dashboards with.
At the time I was somewhat new to BI but had read Ralph Kimball’s “Data Warehouse Toolkit” and had learned the Cognos stack. I understood the ins-and-outs of “cubes”, “dimensions”, “measures”, and detail-drill through reports. In my mind I felt somewhat confident that I knew what “Business Intelligence” was and how it could help companies.
But what I saw in that demo that morning over brunch blew my mind. The first thing I noticed was the speed. Everything was instantaneous with no lag. She would click in a chart and everything on the page would appear to magically update itself to be consistent with her selections. I then noticed how she would casually go to any field and filter on it. It felt like the world of Dimensions and Measures I had been accustomed to had been flattened and that hierarchies were something arbitrary, and that one could merely follow one’s own train of thought to answer any business question.
I was blown away and could not stop thinking about Qlik.
After returning from my vacation I continued to think about the demo I saw. It just didn’t line up with what I knew about BI through Cognos and I would mention it to people who I thought were BI experts and they never heard of it.
When I searched Google for reasons Qlik was not more popular, I eventually found one that made some sense to me: Qlik’s indexing technology required all data be loaded into RAM (computer memory) and that RAM was scarce so Qlik was not a realistic technology for many large companies with lots of data. A big problem was that most computers ran on 32-bit operating systems that could only reference 4 GB of RAM in total and only 2 GB of RAM for any given program.
But around 2008 something started to change. What happened was this was around the time that Microsoft “Windows 7” came out and Windows 7 was selling more 64-bit versions than 32-bit versions. In turn this meant that 64-bit versions of applications could now address up to 2 TB (terabytes) of RAM which at the time was more than most companies had in their data warehouses. As a result, Qlik was now positioned to take on large volumes of data and began to surge in popularity.
This would be the beginning of a new golden era for Qlik.
By 2009 Microsoft caught wind of this disruptive trend and had announced a new Business Intelligence platform was under development. This platform was code named “Project Gemini” and was slated for an initial release by the end of 2010. I followed this news closely and recall Project Gemini having the most lead time of any Microsoft project to date. In other words, it felt like Microsoft was firing a shot across the bow against Qlik.
I was excited by this news. I liked the idea that Microsoft was embracing Qlik’s innovations and looked forward to having an alternative to Qlik with all the same benefits. I had experimented with other tools like Tableau and Microstrategy and others but because they were all built on cube/OLAP based platforms (even Tableau), they lacked the flexibility, responsiveness, and User Experience that Qlik had.
By 2010 Microsoft had released the first deliverable from Project Gemini: PowerPivot, a plug-in for Excel.
After experimenting with PowerPivot for while I could see its potential. I was relieved to see Microsoft had essentially copied Qlik’s SEMI-JOIN linking model which Microsoft dubbed “The Tabular Model” and they also introduced a new language to go along with the Tabular Model called DAX (Data Analysis Expressions), replacing the older MDX (Multi-Dimensional Expressions) language which had been built for the “Multi-Dimensional Model” which was now seeming obsolete. Currently, MDX is no longer supported by Microsoft in their cloud products – it’s Tabular and DAX all the way now.
I warned BI sales people that Microsoft was just warming up and had laid the foundation for disrupting the BI industry given their huge platform leverage – more so with their Office suite than the Windows platform.
I am aware of Microsoft’s history as the “fast follower” who gobbles up disruptive technologies like Qlik in the same way Star Trek’s “Borg” assimilates new life forms into its Cube Colonies. Microsoft is after all a creature of capitalism, and capitalism is all about leverage, and Microsoft’s platforms give it huge amounts of leverage. It’s not even close to an even playing field in the software industry. Case-in-point: There was a big law suit that ended in 1999 with Microsoft being ordered to be broken up after destroying Netscape (and countless other small companies). But then George W. Bush was elected and that judge’s decision was overruled and basically canceled. This was still a black-eye for Microsoft and they behave more gently than in those days – some say Google would not exist had this not been the case – but few people know anything about Business Intelligence (it’s not quite a consumer technology), so I figured Qlik would be Microsoft’s crosshairs.
To be clear, I am speculating here. I don’t have any documentary evidence to present here that Microsoft was indeed “following” Qlik; This is an educated guess.
Regardless of their motivations, Microsoft had developed a tool that for once presented a formidable competitive product to Qlik.
It should be noted that Tableau was also disruptive (their golden era would arrive around 2012) as they had developed a very user friendly “drag-and-drop” interface for self-serve BI. They also invested heavily in engaging data visualizations. It has been said that Narcissus was seduced by the image and in this same way Tableau was very seductive; it had superior aesthetic to its competition. Tableau also wisely invested in academia by giving its licenses for free to all college and university students. But Tableau eventually would see its own growth stunted for it lacked the depth of tools like Qlik and Power BI, and many users would often hit brick walls concerning scalability and performance with Tableau.
Enough about Tableau.
It would not be until 2015 that Power BI was released. The main reason for it taking so long between the release of PowerPivot and Power BI is that Microsoft unfortunately lost time on a fruitless detour. Namely, in response to the criticisms of PowerPivot being too much of an Excel tool and not like a “real BI tool”, Microsoft’s answer to this problem was to invent “PowerView”. PowerView was a server based product that would finally allow IT departments to roll out “Enterprise Business Intelligence” solutions through the users web browser. The technology was built an another Microsoft technology called “SilverLight”. Silverlight ended up being shut down as it was deemed by the wider technology community to be something of a withered rump following a keynote speech by Steve Jobs where Jobs stated that he would not support Adobe Flash on the iPhone as it was seen by Apple as a battery hog. Instead, Jobs went on, Apple would throw its support behind the open HTML5 standard which could be made more energy efficient to run. That was then death knell for Adobe Flash and would be the death knell for Microsoft Silverlight, and in turn PowerView.
In 2015 Power BI was released – built entirely on the open HTML5 standard that Steve Jobs was hyping for the iPhone.
In 2016 I was a consultant working for a large business and technology consulting firm. We were technology advisors and perhaps I was lucky, but I can genuinely say that the people I was working for were happy for me to recommend Qlik as the best Business Intelligence software with Power BI being the next best alternative starting in 2015.
Nevertheless, I couldn’t help but notice that even if I could convince a business department that Qlik was the way to go, I would inevitably get blocked by an IT department that would claim they had decided some other tool was already decided upon and that there was no room for Qlik. I would explain the reasons why Qlik was able to meet business scenarios better than the tool they had decided on. Sometimes I would even be able to persuade the person I was speaking with, but they would inevitably send me an e-mail explaining the decision was out of their hands.
Some of my colleagues at the consulting firm I worked for took notice of Qlik and admired it, but if their careers were deeply intertwined with Microsoft or another large vendor, they would continue to cast aspersions of doubt around Qlik’s ability to do this or that (usually scaling to beyond 2 Terabytes). But as soon as Power BI started to gain traction, the Microsoft consultants were quick to forget their skepticism of Qlik and were almost instantly True Believers of Power BI.
It was at this point that I could see the power of Microsoft’s leverage working from all sides.
Part of me was happy to see that Qlik had a strong competitor as it gave me more leverage when negotiating license terms with Qlik. I had also hoped that others would see the underlying relationship between Qlik and Power BI. This has barely happened.
I mentioned earlier that “Narcissus was seduced by the image”. If you are lucky to get a captive audience and show them a 10 minute demo of some BI dashboard, no one in the audience will be able to tell you anything about the underlying data model and how it works. It’s invisible.
And when it comes to features like State-Aware UX and Full-text associative searching, unless you have come to appreciate those benefits you will lack the connoisseurship required to appreciate these things.
To use an analogy, when it comes to Business Analytics, most people’s level of connoisseurship would barely allow them to tell the difference between an overcooked Salisbury Steak and a perfectly cooked Chateaubriand.
If this analogy comes across as snobby and out-of-touch, well that’s partly my point. The finer things in life are typically out of the reach of most people – not as much for lack of money, but mostly for lack of education. Yes, the two are related, but it is also possible to have one without the other, and in this context, connoisseurship is more important than money, and connoisseurship (refined education) can be achieved without a lot money if you are passionate about the subject at hand.
This finally brings me to the point of this blog: I have recently concluded that while Microsoft may have been a “fast follower” of Qlik, the Microsoft Power BI culture lacks the connoisseurship of Qlik and has – in my opinion – subconsciously embraced a philosophy that is more top-down and cube-like than what it is truly capable of.
What are these two philosophies exactly?
- Qlik’s philosophy tilts bottom-up, and believes that all Business Intelligence should work like the human mind – where we can hop from concept to concept with no preconceived structures
- The example they often site is how our thought process works if we lose something like our keys:
- We scan through a list of places we have been (e.g. outside walking, driving, going to the mall, etc.)
- Then we drill-down on subjects that we think are more relevant; We might start to list out all the places in the shopping mall we visited
- Eventually after jumping from list to list, we eventually find what we were looking for “I left my keys in the shoe store in the mall when I put them down to pay for the shoes”
- Microsoft’s philosophy tilts top-down and embraces the perspective of the CEO
- Time should be spent up-front planning out Dimensions and Hierarchies that in turn reflect a “single version of the truth”
- We always start with Big Rocks (e.g. Years and Countries) that can be broken into smaller rocks (Dates and Towns)
- Outliers can be discovered by drilling progressively from Big Rocks down to Little Rocks
- A key outlier will eventually be discovered that can be used to drive better results
I should point out that Qlik’s philosophy allows for an embrace of both the bottom-up and the top-down. But Microsoft’s top-down philosophy is more difficult to invert.
Put another way “Splitters can be lumped more easily than lumpers can split”
So in my view, Qlik is more of a “Splitter” philosophy with Microsoft embracing more a “Lumper” philosophy. As you shall see, it is possible to make Power BI act like Qlik. Well almost.
To explain more of I mean here and how I came to this conclusion, I have created an example that I believe clearly illustrates these two philosophies.
In this example I have a small dataset that includes 2019 populations for three countries:
- Australia;
- Canada; and
- United States
This dataset includes both national totals as well as State/Province totals for each State or Province. Although I have not included any non-state districts or territories. So the country total is not exactly the same as the total for all provinces and states.
I have instrumented this dataset such that it supports “natural linking”. Namely, I have named each column/field such that I am indicating to both Qlik and Power BI how the tables ought to be linked.
In the Qlik’s case, linking is linking. There is no option in telling it how to link apart from the fields to connect.
But with Power BI, a link may be either “Single” direction or “Both” directions (also known as bi-directional links). So it is here we can see Microsoft showing its hand when it makes one link “Single” and other “Both”
I have pasted below snippets of the raw data so you can see how the fields are laid out:

Dim_Country
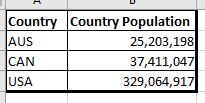
Fact_Country
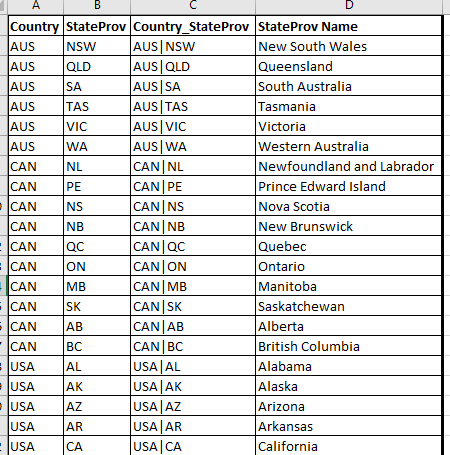
Dim_StatProv
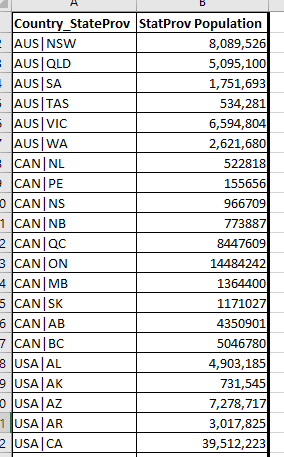
Fact_StatProv
Once I load the data into Power BI as is, Power BI automatically links up the entities based on a combination of looking at Field names and profiling the underlying data cardinality.
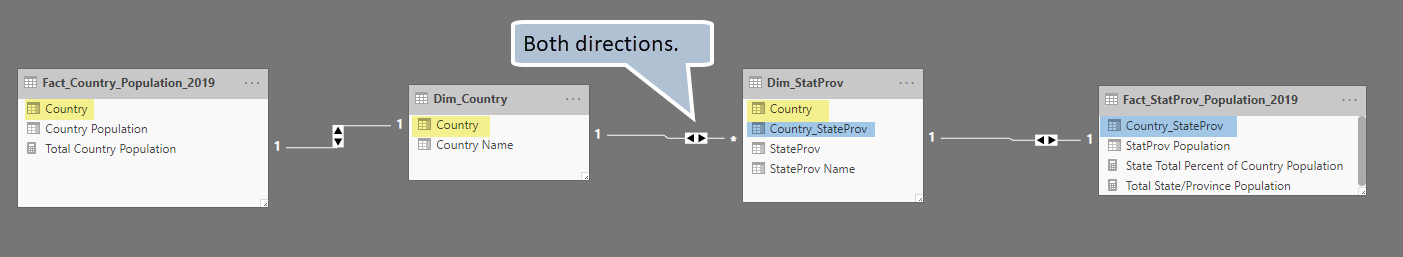
Here is Power BI’s automatically generated the model:
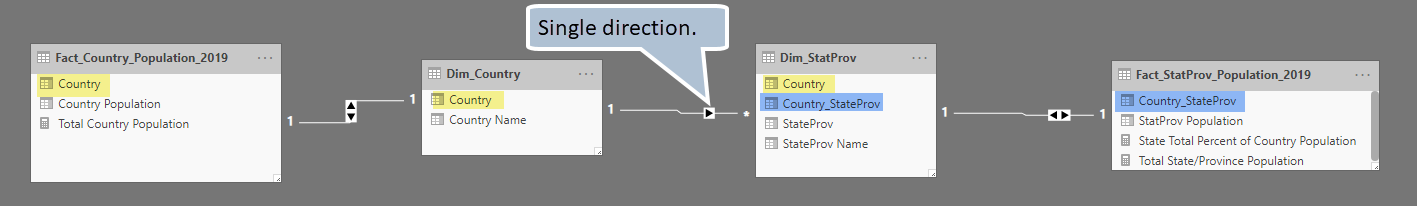
I have highlighted the key fields so you can see clearly how the tables are linked.
Notice how the link between Dim_Country and Dim_StatProv flows in one direction, top-down from Country to State/Province.
Now if you look at the Qlik model you can see it’s more-or-less the same, with the main difference being that all links are bi-directional (all links in Qlik are always bi-directional – there is no Single direction linking in Qlik).

If you just look at these diagrams it will not be clear how this link direction actually impacts the User Experience, so I have built the same dashboard in both Power BI and Qlik Sense so we can get a better sense of how this subtle difference changes the user experience.
To give the dashboards something to analyze I have also created the following three Measures:
- Total Country Population
- Defined as: SUM([Country Population])
- Total State/Province Population
- Defined as: SUM([StatProv Population])
- State Total Percent of Country Population
- Defined as: SUM([StatProv Population]) / SUM([Country Population])
I should also remind you that “Total Country Population” does not equal “Total State/Province Population” because I have left out any regions that are not strictly states or provinces. For example, DC (District of Columbia) and the Yukon Territories are not included in the State/Province populations but are included as part of “Country Population”.
Let us take a look and compare the Power BI and Qlik dashboards respectively, starting with this Power BI Report (dashboard):
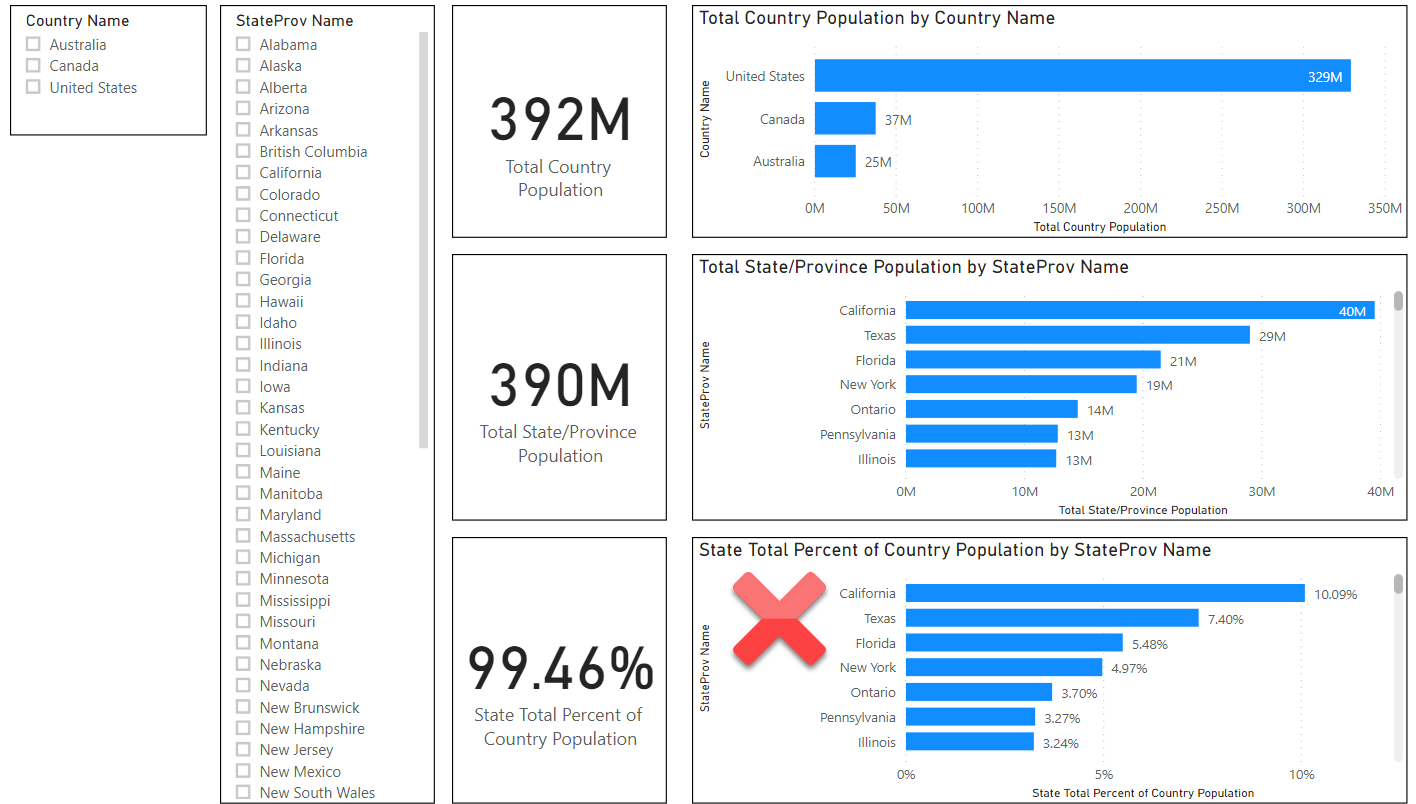
In this Power BI Report we can see everything looks quite normal and the numbers all appear to make sense except for the bar chart on the lower right (where I have placed a large red ‘X’) which shows the States/Provinces ranked as a percentage of their country’s population.
We can see California is ranked at the top of the list, when the correct answer should be Ontario. The reason why we get California is that the Single Direction link is preventing Power BI from linking the State’s population back to its parent population, so it is comparing against the population of all three countries. This phenomenon is known as a “chasm trap” and Power BI has stepped right into this trap so to speak.
That said, there may be ways of getting around chasm trap this using advanced DAX expressions; I don’t want to mislead readers in thinking there is only one way to solve this problem. My point is to show how the default assumptions Power BI makes when creating links can lead to misleading totals when using Measures that aggregate across linked fact tables.
For comparison let’s look at Qlik’s dashboard:
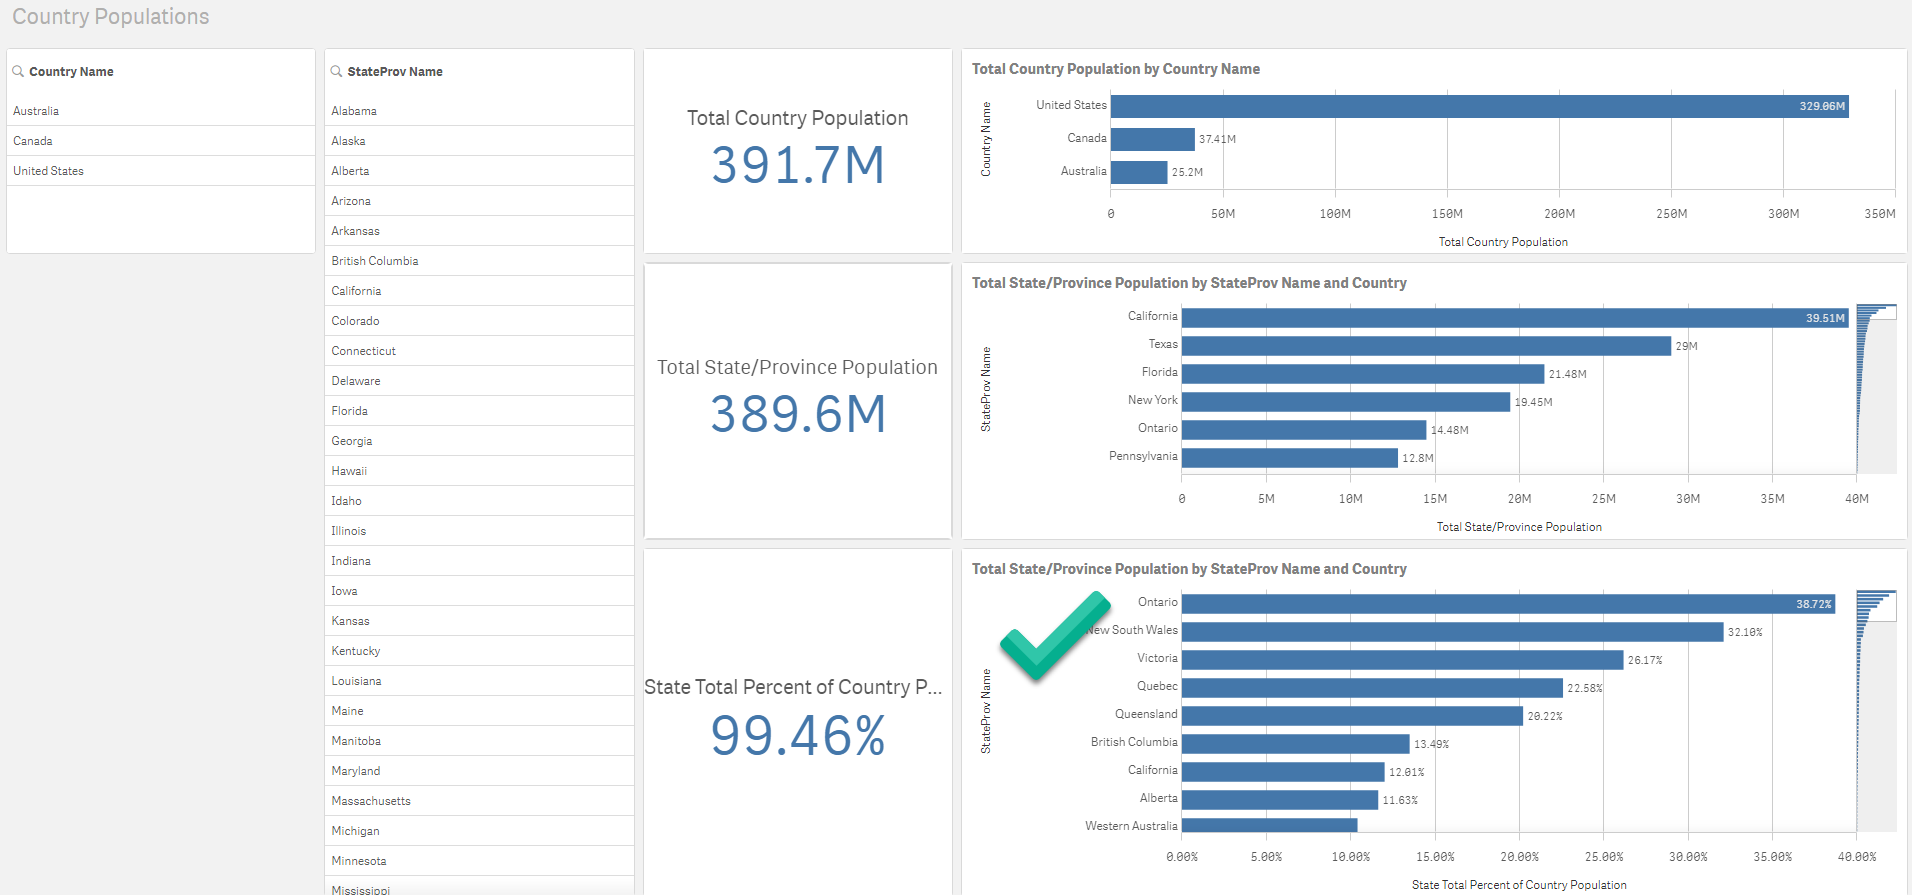
In this Qlik dashboard we can see that Ontario is ranked at the top of the list with 38.72% of Canada’s population. I have placed a large green checkmark to make it easy to find. You can also see that most of the States/Provinces on this list are from Australia or Canada as you would expect. Whereas in the Power BI Report, the top of this is mainly made up of large US states.
The reason why Qlik gets the correct answer here is that its links are all bi-directional (“Both” directions) with no “Single” links at all.
Now let’s look at what I really wanted to demonstrate here which is the interface for making field selections (generally known as “filtering”).
In this first example Power BI this is how it appears when a country is selected in the Country Slicer:
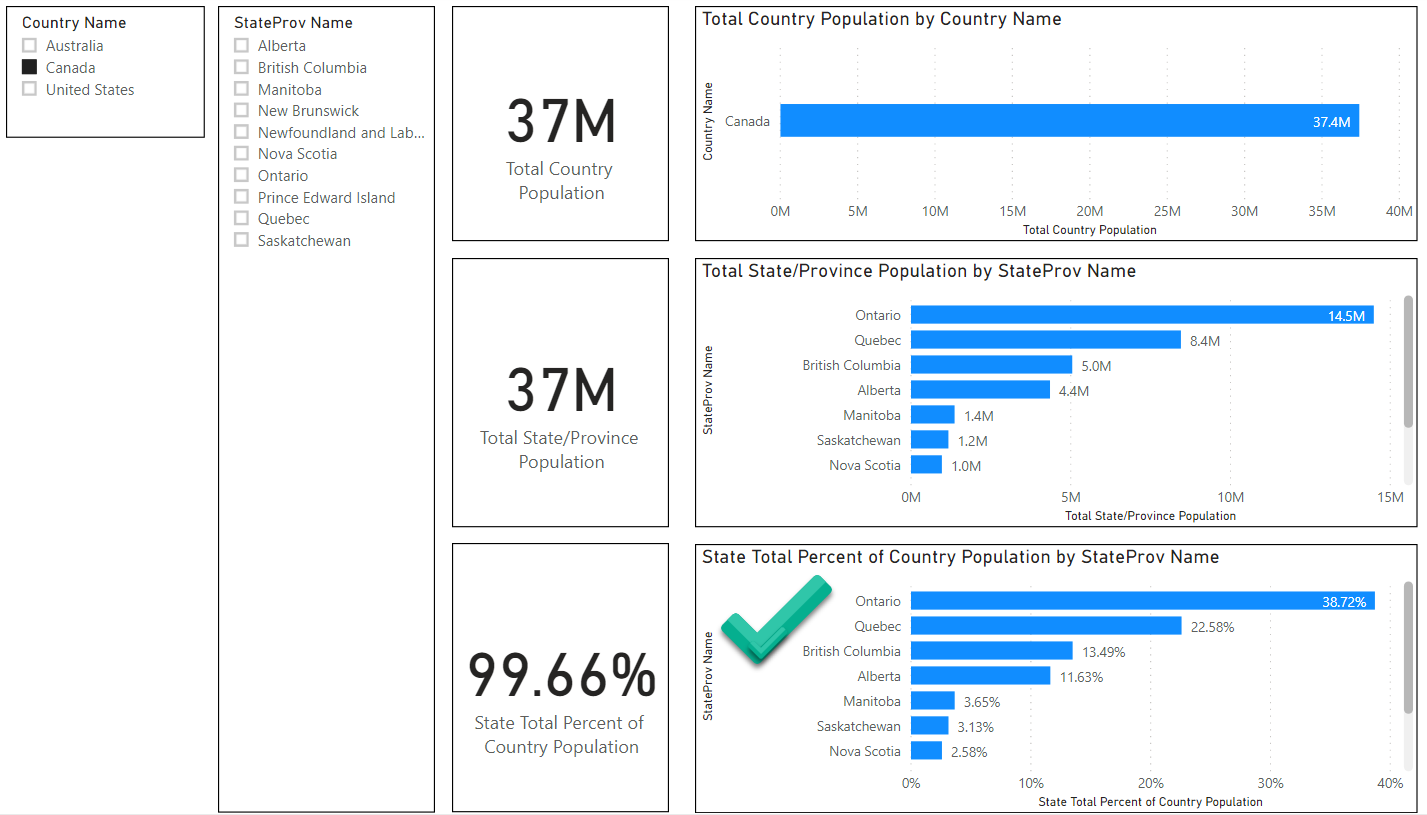
As you can see, the interface is intuitive. We can see what country (Canada) is selected as well as the alternate countries that are possible to select. Furthermore in the “State/Province” Slicer we can see all the provinces that are specific to Canada while all of the other States in both USA and Australia are completely hidden.
We can also see that when we select a single country that our chart in the lower right corner is now producing the correct results, since have effectively eliminated the “chasm trap” by explicitly filtering on a single country.
We can also see that when we select a single country that our chart in the lower right corner is now producing the correct results, since have effectively eliminated the “chasm trap” by explicitly filtering on a single country.
If my objective is to drill down from the top (e.g. Countries) down to the bottom (e.g. States/Provinces, or perhaps lower down), then this presentation and UX is decent.
Let’s compare this to Qlik’s dashboard with the same selection:
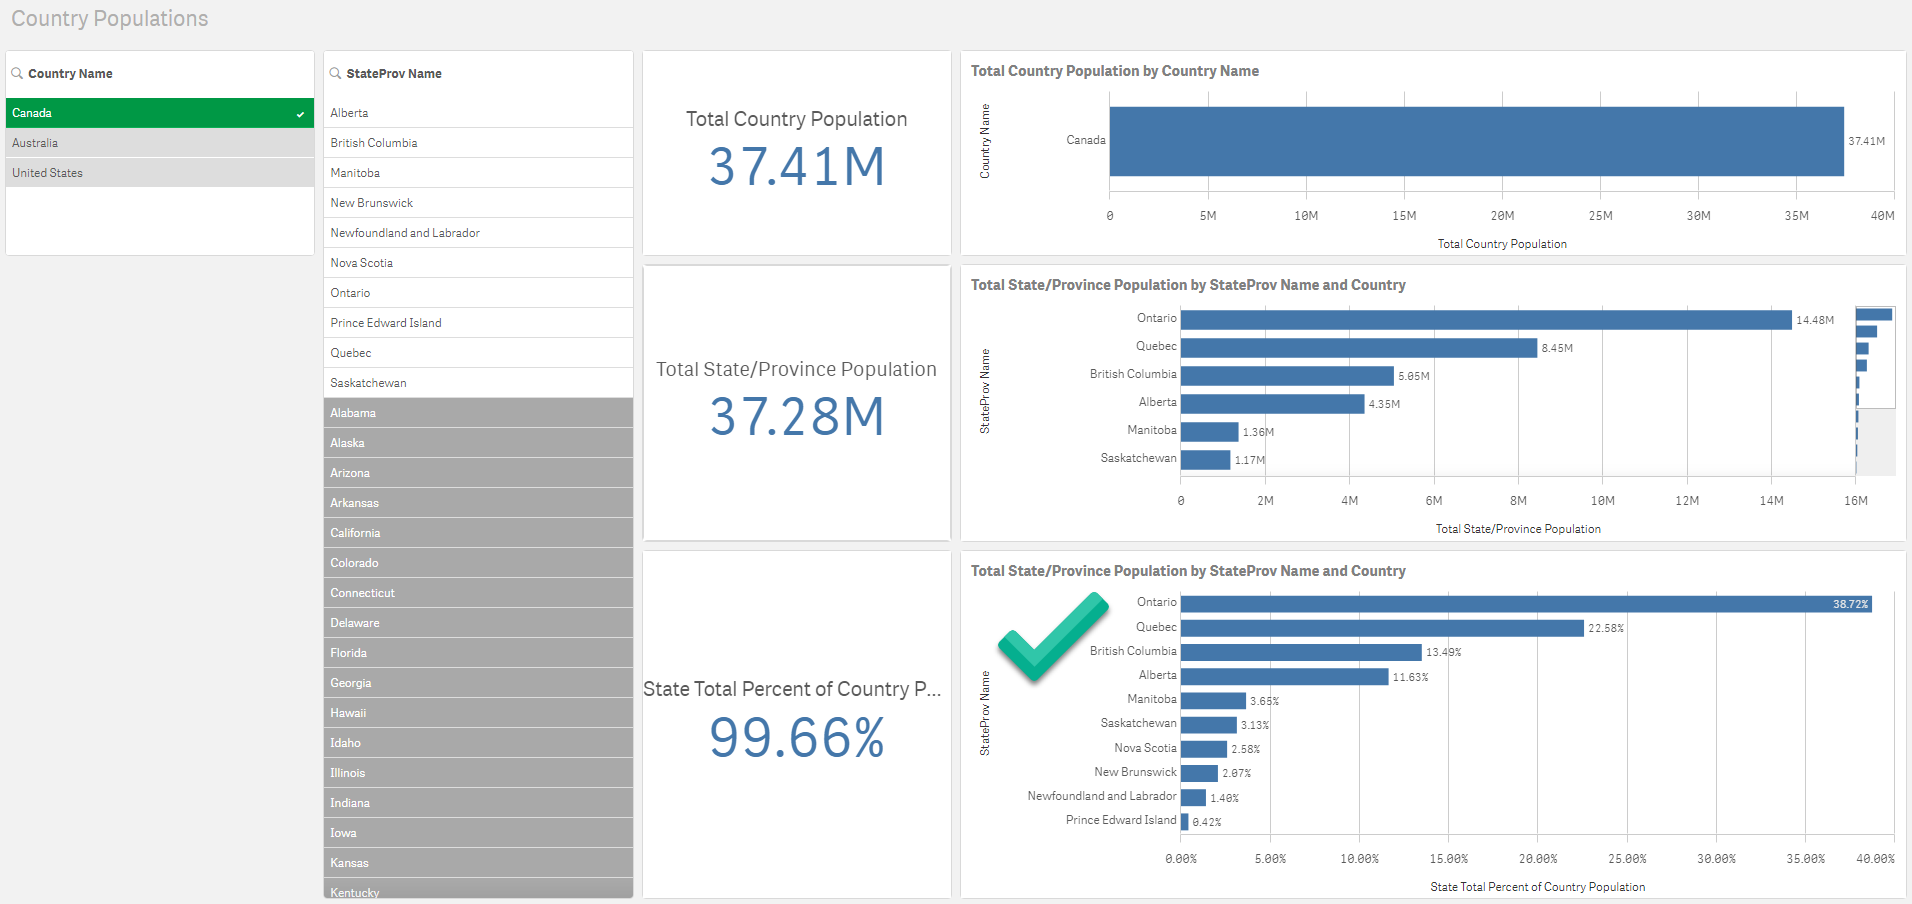
As we can see the same country “Canada” has been selected and we can clearly see the 10 provinces of Canada with a white background. But where things differ is that we can now see a list of the excluded States from the other countries. While our analysis is not strictly concerned with these regions, they are available for selection should we choose to change our course of questioning.
I’ve already shown you a couple minor points of contrast between Power BI and Qlik, but now I want to take you to the most salient point of contrast between the two tools. Namely, what happens when we select a “State/Province”.
Here is how this appears in Power BI when we select the province of Ontario:
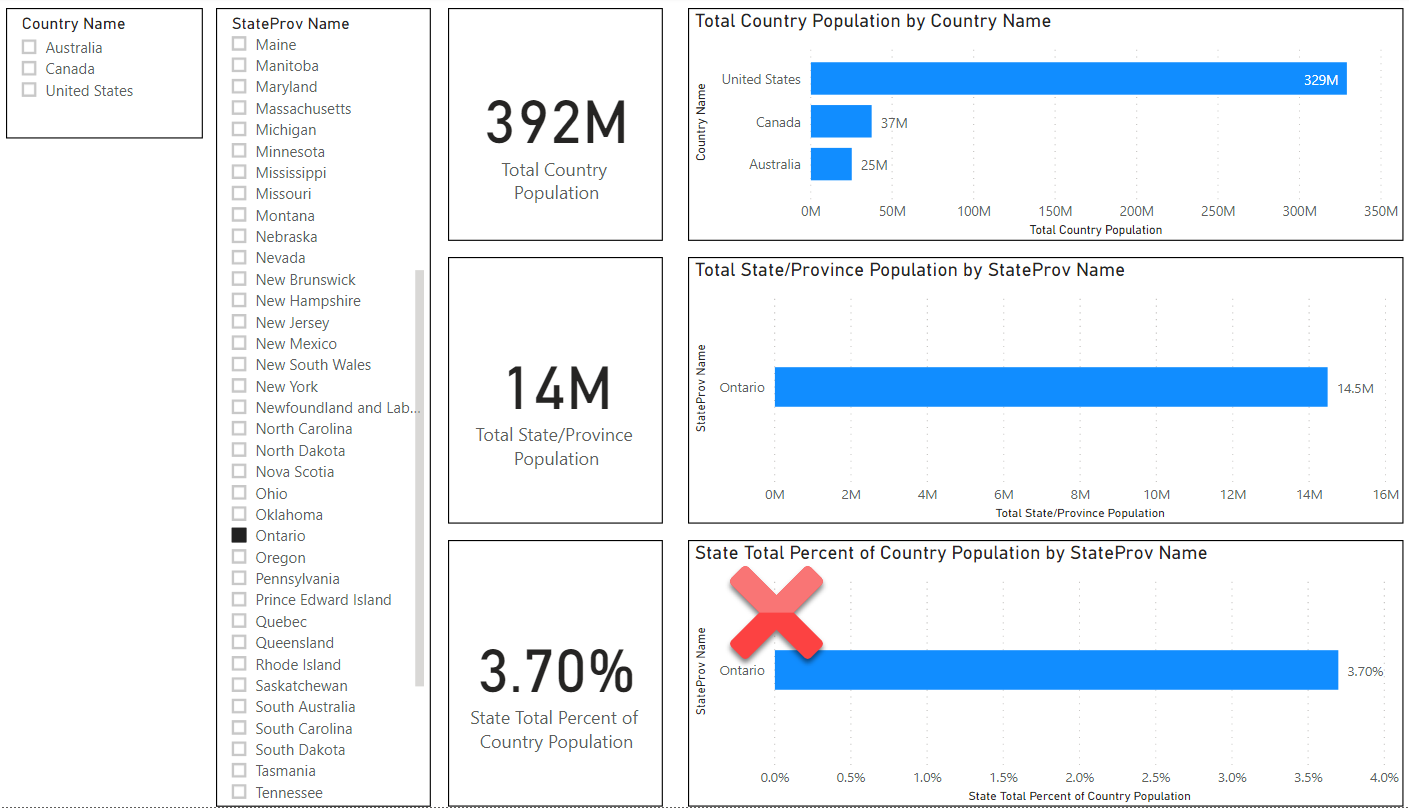
In my view, there are two issues with this selection. First, I can see at the bottom right that my percentage calculation is off (as was the case earlier when no selections were made). Ontario is only showing as 3.70% of the total population when it should be 38.72%.
What is new and most frustrating about this is that when we look at the Country Name Slicer we cannot easily see what country Ontario belongs to. Yes, I know it’s obviously Canada, and most people know their own states or provinces. But I can imagine there are some Americans who might not know if a non-American State/Province is Canadian or Australian, and this dashboard will not tell us that unless we exhaustively go back to the top and click on each country one by one.
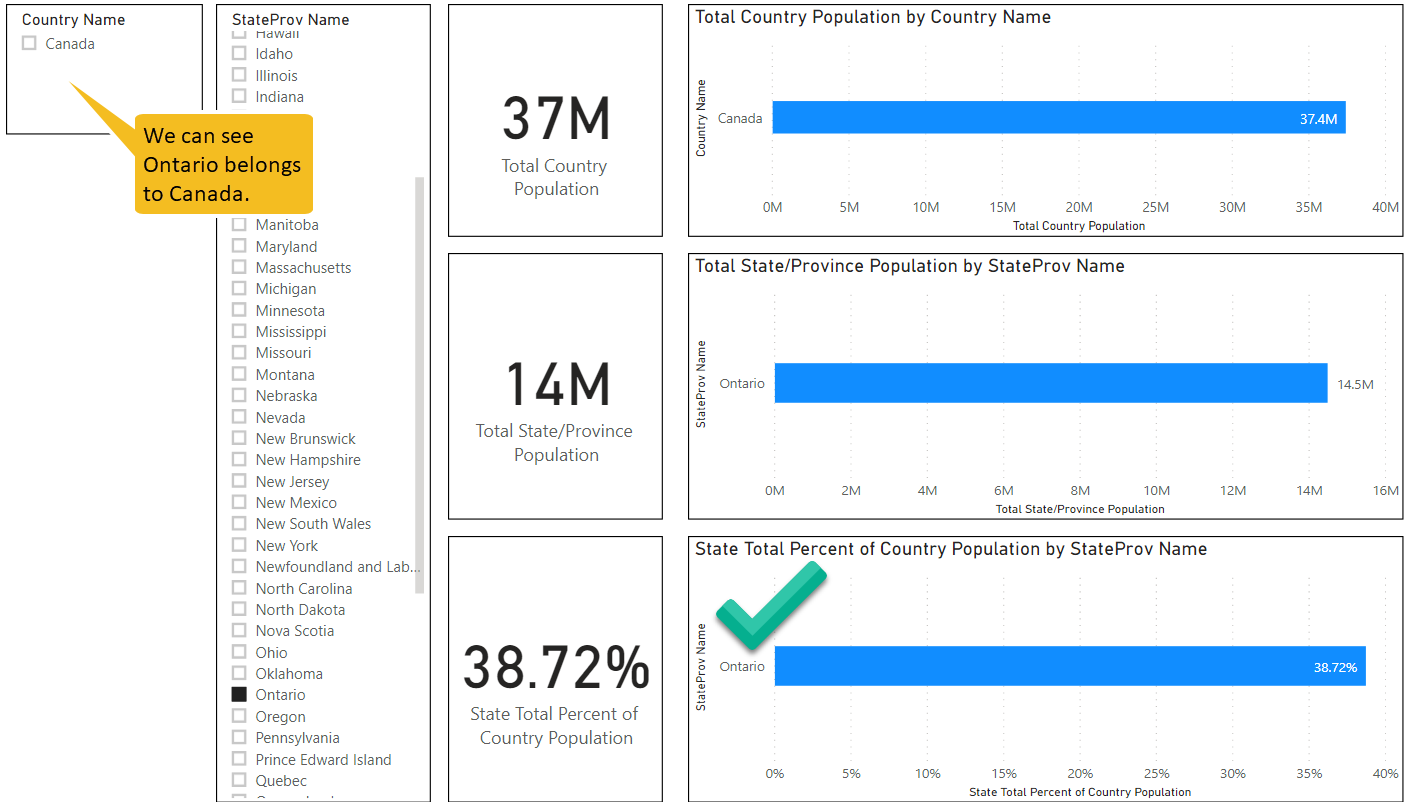
Let us finally compare with the Qlik example:
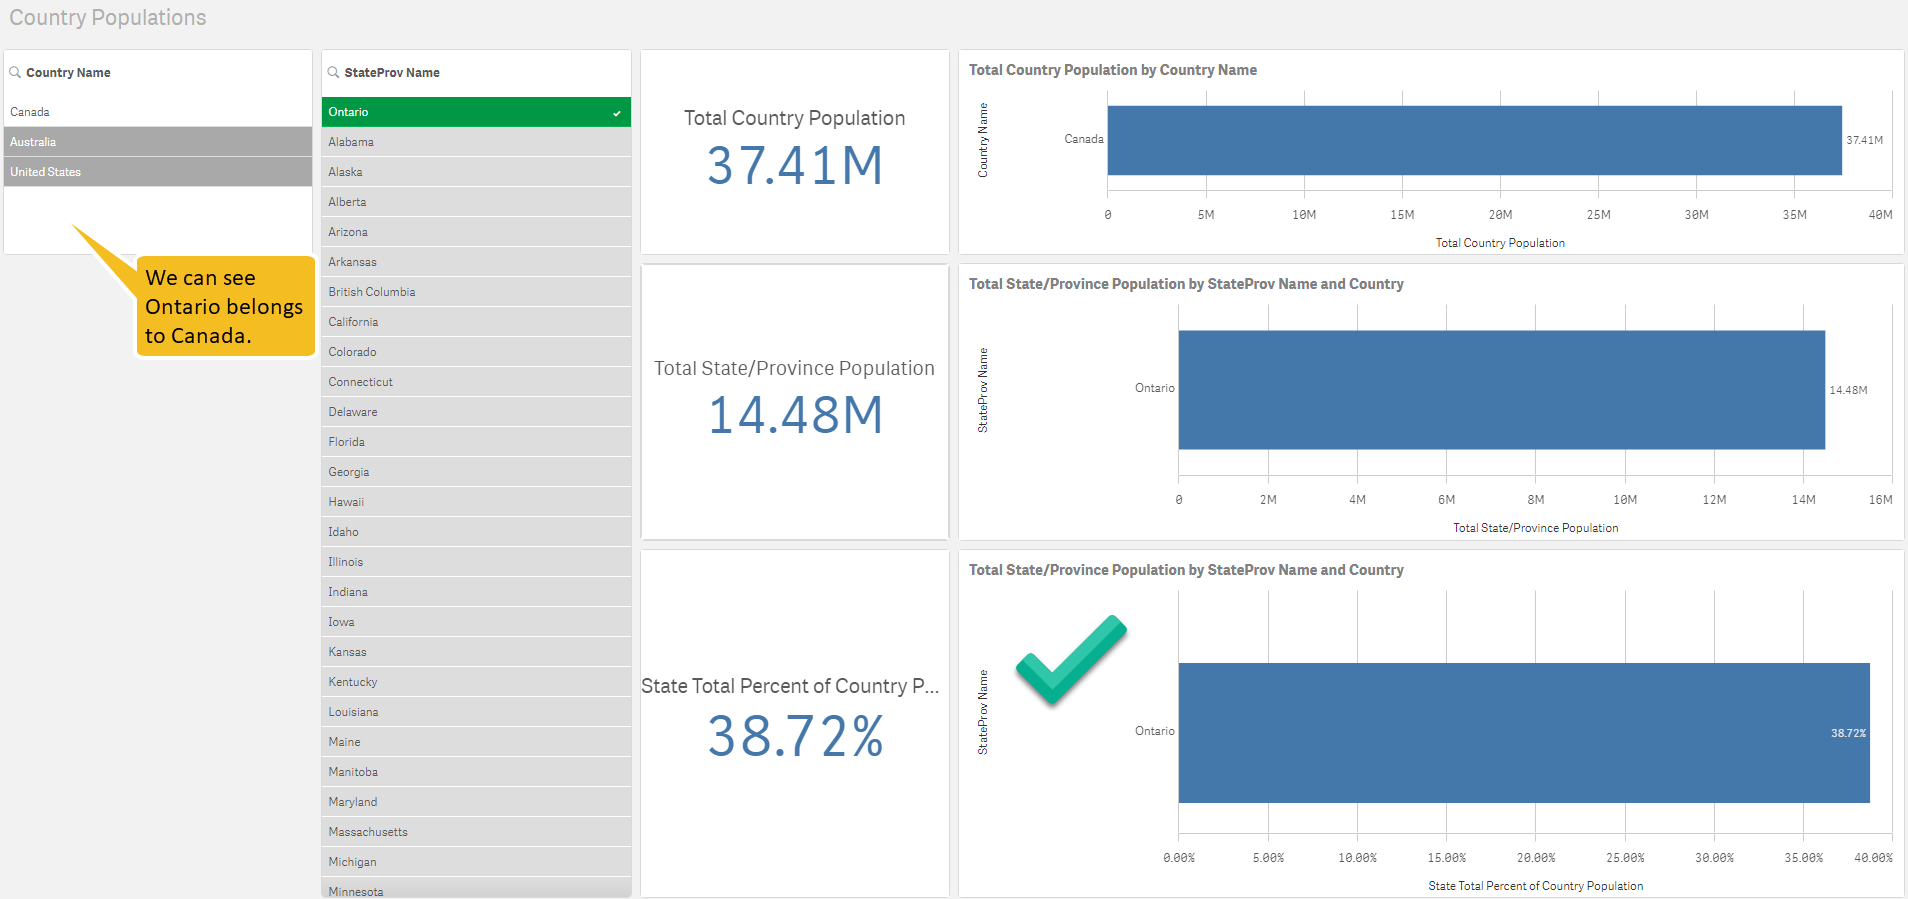
As we can see the chart in the bottom-right is producing the correct result of 38.72%.
More significantly, we can clearly see that Ontario belongs Canada to by looking at the “Country Name” Filter box.
The reason why this is significant is that Qlik is allowing us to go back up the hierarchy but choose any path we would like. In other words, Qlik is basically telling us the hierarchy need not be traversed as a hierarchy but however we would like.
And this gets to the essence of the “tao of Qlik”: Qlik is allowing us to ignore the typical user constraints of hierarchies and instead invites our minds to wander.
To a cynic, this idea of “wandering” through data and breaking down hierarchies might come across as some post-modern hippy dippy mumbo jumbo. But in my experience this flexibility has led to tangible benefits.
You see Analytics is basically a game of “20 questions” (if you have never heard of “20 questions” – it started as a British gameshow and these days is a fun game you can play over a dinner table with just two people). The more questions you can ask the faster you can drill down to the final answer. I have used Qlik’s flexibility to both solve business problems that were unsolved as well as develop very flexible dashboards where I was told after demoing the dashboard “How did you do this so quickly? Was it you or was it the tool?” where I respond: “I appreciate the complement, and I am proud of my work, but I would not have been able to complete it so quickly without this Qlik tool and its unique features.”
I am a critic and skeptic at heart and the idea of rallying behind a for-profit corporation is not how I see myself. I am somewhat uncomfortable lavishing this praise on Qlik. The point of this post is to show that my objections to other tools are not based on some “Coke versus Pepsi” preference, but are rather rooted in fundamental philosophical differences, and I wish that other tools and vendors would get this point and start competing on the same philosophical ground that Qlik has laid out.
In that spirit, let’s go back to Power BI and modify its linked model to make that Single Direction link bi-directional to see how this changes things.
First here is a picture of the modified model so you can see the difference:
Now let’s take a look at the dashboard when there are no selections.
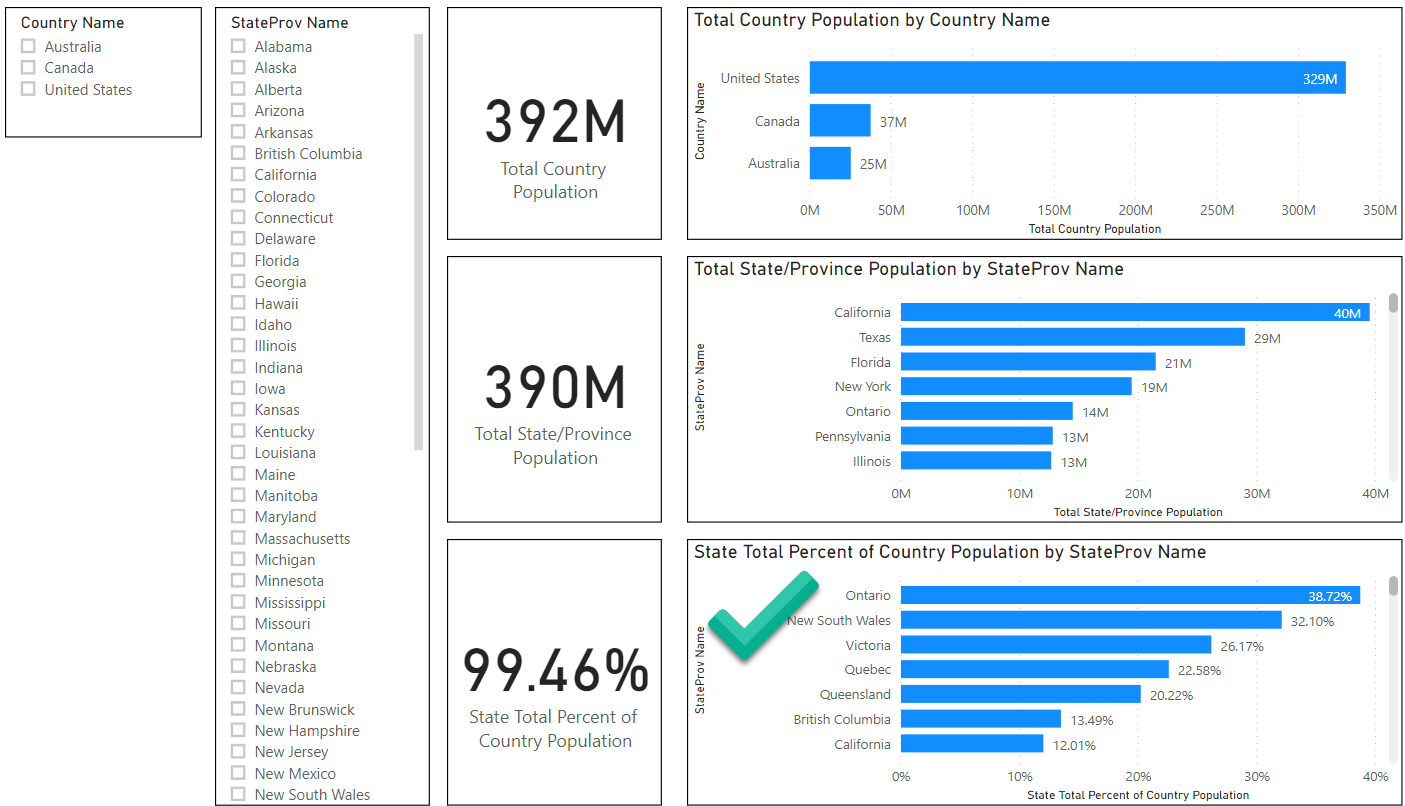
Here we can immediately see in the lower-right bar chart that that the Percent calculation is correct and Ontario is at the top of the list.
Now let’s take a look at scenario where we select a State/Province:
Here too, we can see something of an improvement as Power BI is telling us that Ontario belongs to Canada. But we cannot see the alternative countries now, whereas before when there was a Single direction link, we could.
So by replacing that Single direction link with a Both direction link, we have gone from the “tao of Microsoft” to the “tao of Qlik”.
But there is still a bit of a User Experience trade-off with Power BI.
Why is that?
I believe the answer comes down to this patent held by Qlik: US Patent # 6037938 with the inventor Hågan Wolke
The patent is called “Method and a device for displaying information about a large number of independent data elements”. Here is the abstract of the patent:
“A method of displaying a large number of interdependent data elements in a computer screen area that is small compared with the number of data elements to be displayed is disclosed. Each data element is defined by a data element type and a data element value and has an associated status value. The method comprises the steps of displaying the data element types of the data elements as a scrollable list in the computer screen area, and, for each data element type which defines more than one different data element which has a predetermined status value, displaying a predetermined indication thereof in association with the data element type in the scrollable list; and sorting, in response to a change of the status value of at least one of the data elements, the data element types in the scrollable list according to the status values of the data elements defined by the data element types. An article of manufacture including a computer-readable medium having stored thereon a computer program for carrying out the method is also disclosed.”
Can I say for sure this patent is the reason Microsoft is not displaying excluded values in a similar fashion to Qlik? No I cannot say that and I highly doubt Microsoft would ever confirm my suspicion for legal reasons.
But if I am correct in my belief, given that this patent expires today, March 30th 2020, then anyone, including Microsoft should be able to copy this invention without legal repercussions in the US. I am not a lawyer so do not take what I am saying here as legal advice in any way shape or form. Also I don’t know what other jurisdictions the patent has been filed under and how that might complicate Intellectual Property claims. Also, I might be barking up the completely wrong tree – this could all be explained by underlying constraints to Microsoft’s technology that I am not aware of.
To conclude, I wish Qlik the very best and feel they deserve the fruits of their invention. But given that they never really got the Business Intelligence world at large to understand the benefits of their bottom-up philosophy to Business Intelligence this might be a good thing for the world at this juncture.
Still I feel bad for Qlik and I will continue to root for them.
But life’s not fair.

